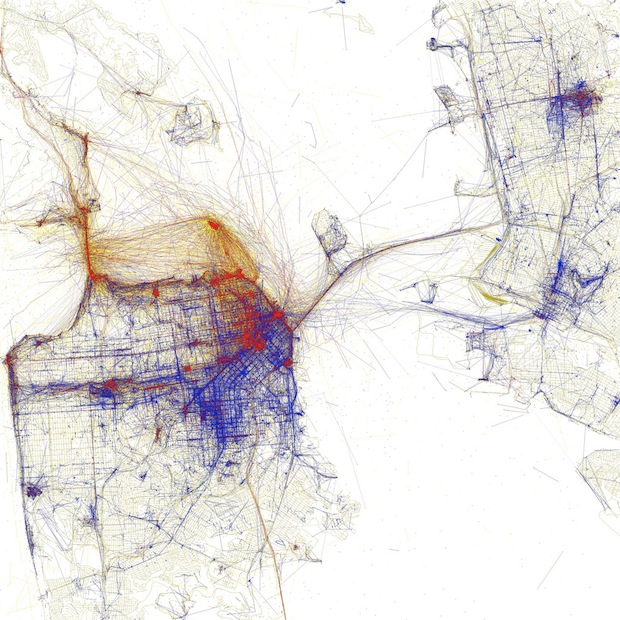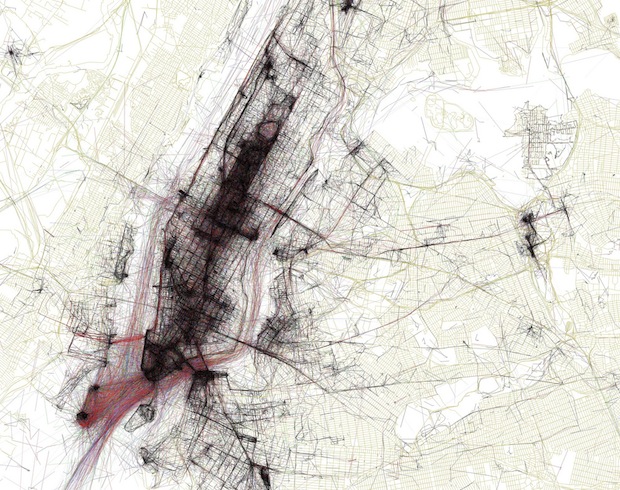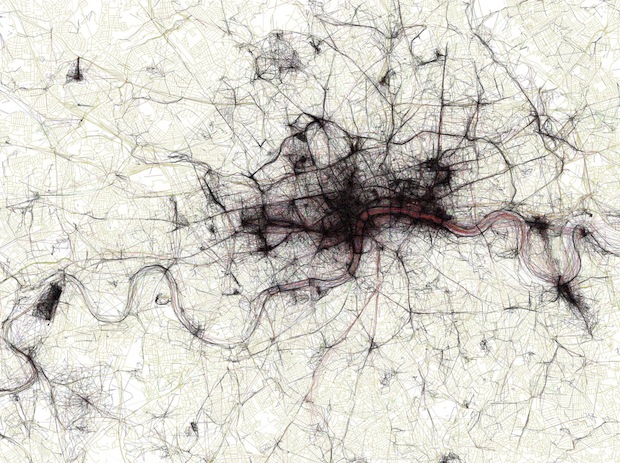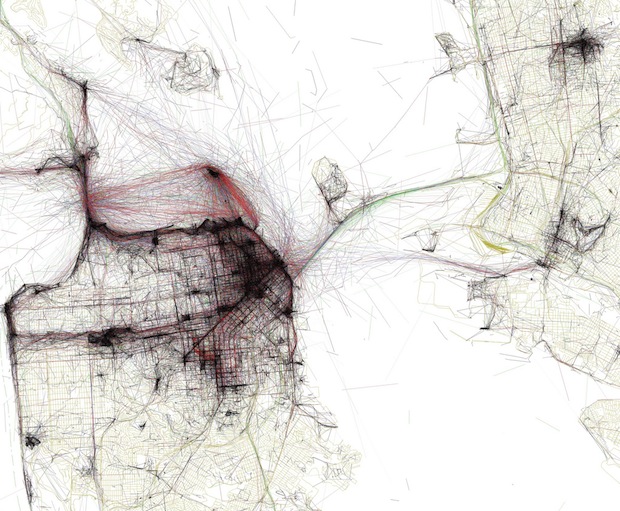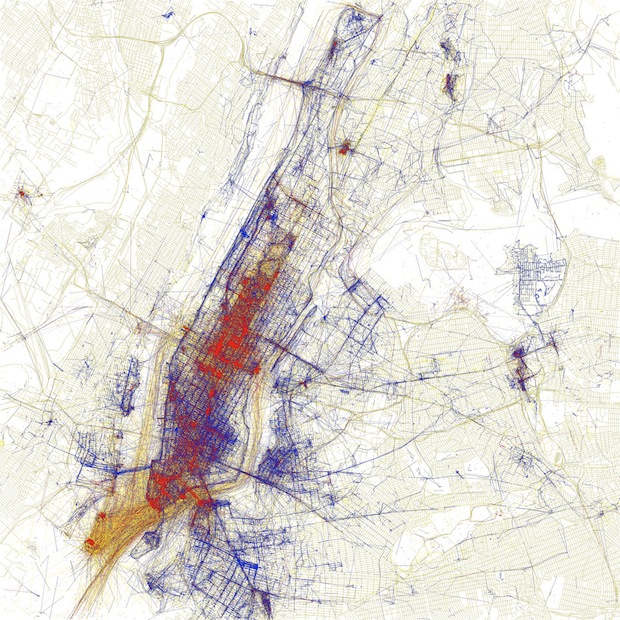
I’ve seen maps of photographic activity around the world, and maps of traffic activity in a city, which reveal how heavily roads are used. And now, photographer Eric Fischer has combined both ideas, creating maps of 50 different cities around the world, using only the geotags of photos uploaded to Flickr and Picasa. What emerges are basically maps of human interest–that is, all the places fascinating enough that someone decided to take a picture. Above, the map for New York, with Manhattan in the center. You’ll also notice a bit of color coding on the maps. Apparently, Fischer was able to guess that the picture taker’s mode of transportation–presumably using the time stamps and distance traveled between a user’s pictures. He then created a color code: Black is walking (less than 7mph), Red is bicycling or equivalent speed (less than 19mph), Blue is motor vehicles on normal roads (less than 43mph); Green is freeways or rapid transit.